

The 2026 Labor Bottleneck Index: How Human + Machine Teams Recover Operating Margin in Essential Industries
Across trades, field services, healthcare, and industrial supply chains, companies do not fail in the field. They bleed margin at the desk. The 2026 Labor Bottleneck Index synthesizes operational data from over 1,500 service businesses to show where white-collar desk tasks strangle frontline gross profit.
direct answer
Across trades, field services, healthcare, and industrial supply chains, companies do not fail in the field. They bleed margin at the desk. The 2026 Labor Bottleneck Index synthesizes operational data from over 1,500 service businesses to show where white-collar desk tasks strangle frontline gross profit.
The Core Finding: The White-Collar Tax on Blue-Collar Margin
For decades, operators assumed that rising labor costs were purely a field technician problem. Wages for electricians, HVAC techs, welders, and equipment operators climbed, and businesses responded by increasing billable hourly rates.
However, our data reveals that field hourly rates are not the primary driver of margin erosion. The true culprit is the "white-collar tax" — the growing burden of desk work, estimate latency, insurance verification, certified payroll, and dispatch friction required to support every billable hour.
In 2026, an average trade business generating $5M to $25M in revenue loses between $140,000 and $420,000 annually in uncaptured billable hours simply because high-value managers, estimators, and dispatchers are bogged down in manual data entry.
- -Estimate latency: 68% of commercial bids submitted after 48 hours are lost to faster competitors
- -Windshield drag: Unoptimized dispatch routes waste 4.2 billable technician hours per week per van
- -Invoice lag: Average Days Sales Outstanding (DSO) climbs from 32 days to 54 days due to missing field paperwork
- -Manager burnout: Operations leads spend 58% of their day manually following up on status rather than directing crews
The Four Critical Bottleneck Archetypes
Our research categorizes operational drag into four distinct archetypes. In almost every case, leadership tries to solve these problems by posting job openings on traditional staffing boards, only to discover that adding more headcount simply adds more communication overhead.
Headcount is a blunt tool. When you hire an extra full-time office employee, you inherit payroll taxes, benefits, training cycles, and management drag. More importantly, you do not fix the broken task architecture that caused the bottleneck in the first place.
- -The Estimate Graveyard: Open quotes sit uncontacted while estimators rush to measure new jobs
- -The Dispatch Logjam: Dispatchers act as human routers, constantly interrupted by phone calls and parts updates
- -The Compliance Barrier: Public works and certified payroll jobs drain administrative capacity with WH-347 filings
- -The Billing Disconnect: Techs finish jobs, but invoices sit in drafting queues for up to two weeks
The Solution: Autonomous Machine Execution with Human Judgment
The winning operational model of 2026 does not replace the human operator. It augments them. By deploying machine execution to handle 100% of repetitive procedural tasks — tracking estimate status, reconciling vendor receipts, matching prevailing wage rates — human specialists are liberated to do what machines cannot: build client relationships, inspect complex field work, and close high-margin contracts.
Organizations that adopt this Human + Machine model consistently report a 30% reduction in overhead costs and a 40% increase in proposal-to-close velocity.
repost & newsletter
Share this framework or read on Substack
Republish these takeaways to your network or subscribe to get our weekly operating playbooks.
faq
Common questions
What is the Labor Bottleneck Index?
The Labor Bottleneck Index is an industry benchmark measuring the cost of administrative, dispatch, and compliance drag on commercial trade and industrial operations.
Why does adding more office staff fail to solve bottlenecks?
Hiring additional staff increases overhead and communication handoffs without fixing the underlying procedural task design. True resolution requires machine execution under human oversight.
How does Jo help companies implement this index?
Jo conducts a LaborMap diagnostic to pinpoint exact bottleneck points, then deploys dedicated machine capacity starting at $40/week.

healthcare
Healthcare labor bottlenecks are intensified by an aging population, persistent nursing and support-role shortages, and long training pipelines for clinical and technical roles. The constraint is not just volume. It is the wrong mix of skilled capacity at the exact moment patient demand keeps rising.
energy
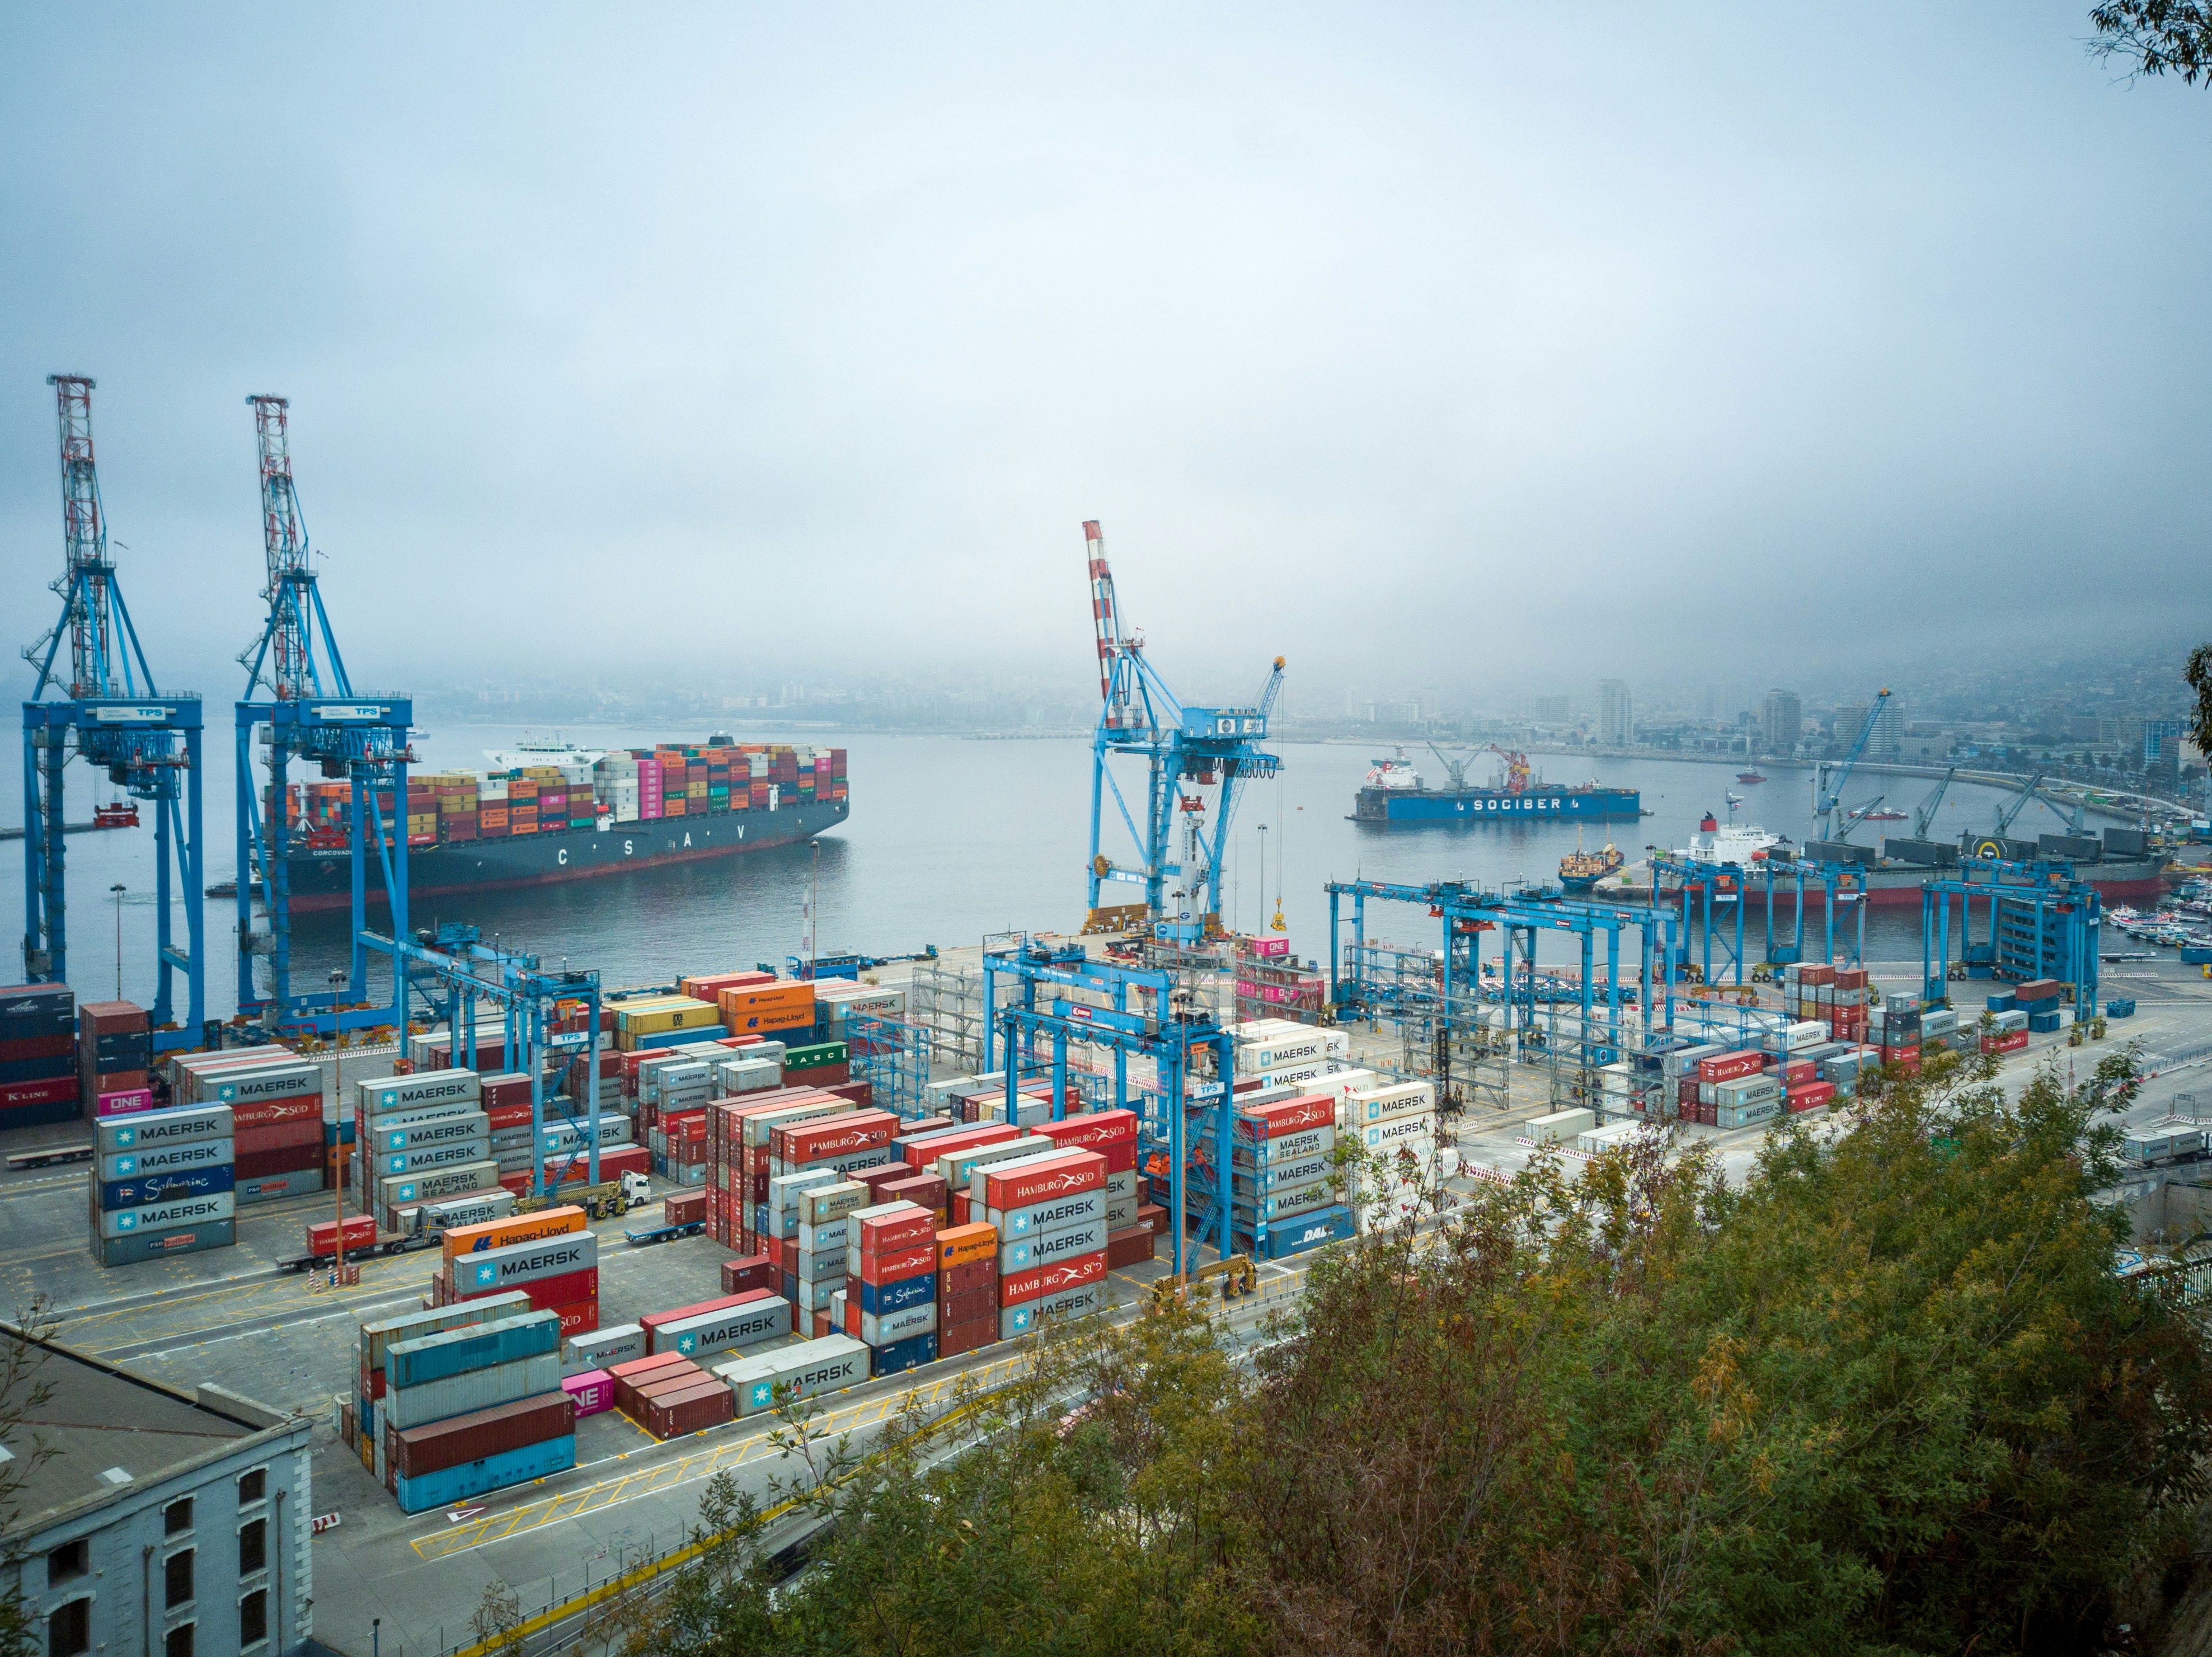
Energy labor bottlenecks sit between retirements in traditional trades and fast-growing demand from renewables, grid expansion, data-center power, and electrification. Utilities and field operations need more skilled workers while experienced staff leave the workforce.

manufacturing
Manufacturing labor bottlenecks come from retirements, reshoring demand, smart manufacturing technology, and a widening skills gap. The issue is not only not enough people. It is training, attraction, and workforce design lagging behind what modern production now requires.
next step
Map the bottleneck inside your operation.
Start with the LaborMap™ diagnostic.
Start LaborMap™ Audit